
More Information
Submitted: July 29, 2026 | Accepted: August 20, 2026 | Published: August 21, 2026
Citation: Millos J, Alvarez-Iglesias P, Fachal Bermudez C, Lomba R, Gomez J, Acuña A, et al. Determination of Essential Elements in Thyroid Samples by Inductively Coupled Plasma Mass Spectrometry and Optical Emission Spectrometry after Tetramethylammonium Hydroxide Solubilization. J Cardiol Cardiovasc Med. 2026; 11(4): 58-70. Available from:
https://dx.doi.org/10.29328/journal.jccm.1001229
DOI: 10.29328/journal.jccm.1001229
Copyright license: © 2026 Millos J, et al. This is an open access article distributed under the Creative Commons Attribution License, which permits unrestricted use, distribution, and reproduction in any medium, provided the original work is properly cited.
Keywords: Thyroid diseases; Cancer; Trace and minor elements; ICP-MS, ICP-OES; Statistical analysis

Determination of Essential Elements in Thyroid Samples by Inductively Coupled Plasma Mass Spectrometry and Optical Emission Spectrometry after Tetramethylammonium Hydroxide Solubilization
J Millos1*, P Alvarez-Iglesias1, Fachal Bermudez C2, R Lomba1, J Gomez1, A Acuña1, J Estevez Sio1, Gil Casal S1, E Lopez1 and V Rodriguez1
1CACTI, Universidade de Vigo, Servicio de Seguridad Alimentaria y Desarrollo Sostenible (SSADS), 36310 Vigo (Pontevedra), Spain
2Complejo Hospitalario Universitario de Vigo (CHUVI), Servicio de Anatomía Patológica, Hospital Álvaro Cunqueiro, 36312 Vigo (Pontevedra), Spain
*Address for Correspondence: J Millos, CACTI, Universidade de Vigo, Servicio de Seguridad Alimentaria y Desarrollo Sostenible (SSADS), 36310 Vigo (Pontevedra), Spain, Email: [email protected]
Concentrations of Bromine, Calcium, Copper, Iodine, Iron, Magnesium, manganese, Phosphorus, Selenium, Sulfur, and Cinc in thyroid samples were simultaneously determined by using a modification of the US Food and Drug Administration method for iodine determination. A total of forty-six pieces of total thyroidectomy from different non-tumoral disorders (Goiter -diffuse or nodular-, and autoimmune thyroid diseases -Graves’ disease or Hashimoto thyroiditis) were analyzed. Among them, fifteen had incidental microscopic carcinoma. Analyses were performed by Inductively Coupled Plasma Mass Spectrometry and Inductively Coupled Plasma Optical Emission Spectrometry after TMAH tissue solubilization and matrix modification by addition of a chelating agent, a surfactant, and a matrix modifier. Accuracy and precision of the method were high, according to the analysis on the certified reference materials SRM-1549, ERM-BB422, ERM-CE278k and NRCC-DORM-3. Descriptive, unpaired t-test, statistical, and univariate correlation analyses were performed on results using GraphPad Prism. No statistical differences in element contents were found when considering groups by sex, Goiter type, or kind of autoimmune disorder. Element concentrations in thyroid tissues were significantly different between goiter versus autoimmune disease samples. In particular, goiter samples showed higher contents of Iodine, Selenium, Zinc, Calcium, and Sulfur, and lower contents of Phosphorus and Manganese. A very highly significant direct correlation was obtained for Mg-P in non-cancerigenous goiter samples, non-cancerigenous autoimmune thyroid diseases, and thyroid cancer log-transformed groups (r = 0.83-0.96, p < 0.001). Non-cancerigenous goiter samples showed a significant direct positive correlation for I-Se (r = 0.74). Cancerigenous tissues showed, on average, lower Zn and Mg contents than benign tissues (×0.71 and ×0.85, respectively). Results reflect different elements’ imbalances (I, Se, Zn, Ca, P, Mn, and S) related to thyroid dysfunctions -mostly due to autoimmune diseases.
Graphical abstract
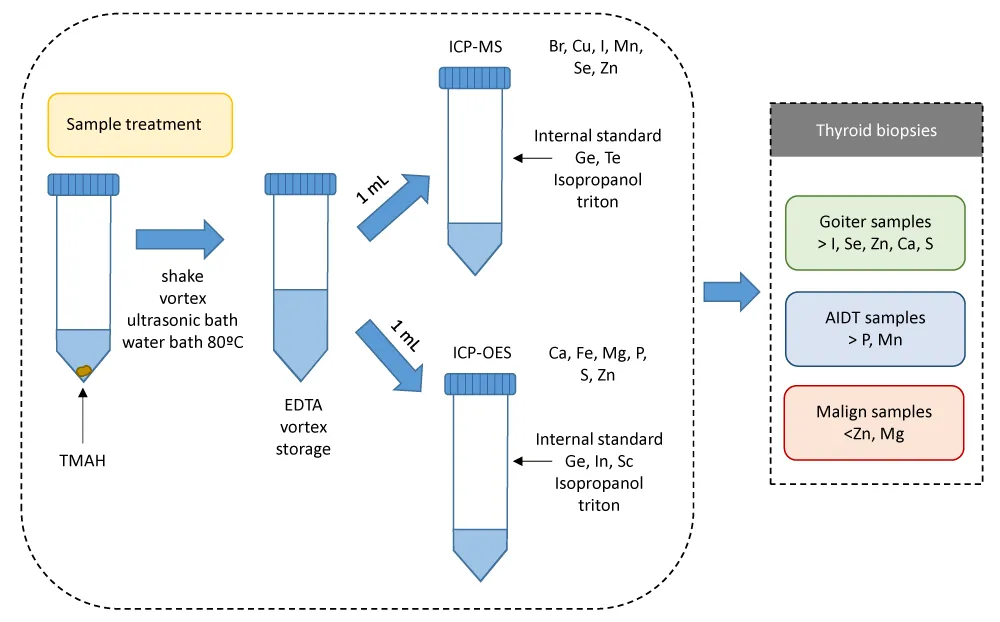
The thyroid gland is an endocrine gland located around the trachea. This gland has important roles in regulating numerous metabolic processes because it produces three hormones: thyroxine (T4) and triiodothyronine (T3) –produced by follicular cells-, and calcitonin –produced by C cells. A series of reactions drives the synthesis and production of thyroid hormones, requiring exogenous Iodine, and also other elements such as Iron, zinc, or Selenium. The feedback mechanism of the pituitary gland and the hypothalamus regulates thyroid function. The alteration of any of these steps produces a dysfunction of the thyroid gland. This may be associated with low, high, or normal hormone production (hypothyroidism, hyperthyroidism, or euthyroidism, respectively), and/or a change in the morphology of the gland, with an increase in size to compensate for the functional defect. Goiter is the clinical name for such an increase in size. There are two main histopathologic types of goiter according to its morphology: diffuse (Diffuse nodular hyperplasia, DG), and nodular (NG). Regarding its function, it is differentiated between non-toxic goiter (diffuse or nodular) and toxic (nodular). Non-toxic goiter is associated with a normal Thyroid-Stimulating Hormone (TSH) level, and it is mainly due to a deficient Iodine intake, although it is also related to etiological factors such as genetic susceptibility, female gender, age, and tobacco smoking [1-4]. Toxic nodular goiter is associated with symptoms of hyperthyroidism, suppressed TSH, or both, and it is due to overproduction of the thyroid hormones.
Autoimmune thyroid diseases (AITDs) constitute another important benign group of thyroid diseases besides goiter. Their physiological and pathological mechanisms are immunological: circulating antibodies are created against thyroid cellular antigens. The most common autoimmune diseases are Hashimoto disease (chronic lymphocytic thyroiditis-CLT) and Graves’ disease [5]. Graves’ disease, also known as toxic diffuse goiter, constitutes the major cause of hyperthyroidism (overactive thyroid gland-OTG), while Hashimoto’s thyroiditis causes hypothyroidism. Both are characterized by lymphocytic infiltration within the thyroid parenchyma. In the case of Hashimoto’s thyroiditis, an increase in gland size may appear at the beginning, but thyroid atrophy is more common. Rarely, thyroid malignancy occurs in goiters and AIDT, with this being more common in the latter [3]. There is a multifactorial etiology for these AITDs with a complex interaction of immune mechanisms, other endogenous factors such as sex or age, and environmental factors such as environmental pollution, smoking, stress, or Iodine and selenium consumption, in genetically susceptible individuals (certain HLA haplotypes) [5-8]. There is also a rare form of chronic thyroiditis of unknown etiology associated with global or partial fibrosis of the thyroid gland known as Riedel’s disease (RD).
The endocrine glands influence trace element metabolism, and trace elements are known to influence endocrine function. Normal thyroid status is dependent on the presence of many trace elements for both the biosynthesis and metabolism of thyroid hormones (THs). Iodine and Selenium are essential elements that play a key role in the thyroid gland [9]. Iodine is a structural component of THs, whereas Selenium is an integral component of several major metabolic pathways of cellular antioxidant defense and cellular redox control, in particular, those involved in the protection of the thyroid gland [10-13]. In fact, the highest Se contents per mass unit are detected in the brain and some endocrine organs, specifically, the thyroid gland [11,12]. Deficiency of these two elements is related to major health problems, such as hypothyroidism, goiter, or endemic cretinism [14-20]. Environmental conditions and agricultural practices condition the intake of these micronutrients, varying their food contents within geographic locations [21-22].
In addition to Selenium, the essential elements Copper, Zinc (as superoxide dismutase), and Iron (as catalase) are critical components of antioxidant enzymes. These mineral micronutrients interfere with thyroid function; thus, their consumption is recommended for hypothyroid patients in order to maintain a normal thyroid hormone function [23-26].
Zinc is an essential trace element for normal levels of thyroid hormones such as triiodothyronine (T3), tetraiodothyronine (T4), and thyroid-stimulating hormone (TSH). Its deficiency leads to a decrease in T3 levels, while its excess can contribute to hyperthyroidism because this element acts as a stimulator of the thyroid gland [27]. A Zn deficiency has been linked to alterations in the immune response [28]. In addition, Zn and Se deficiencies have been associated with thyroid cancer [29].
Other elements have been studied regarding a direct or indirect affection to the thyroid function or on metabolic disorders related to endocrinopathies, including essential elements such as Phosphorus, Magnesium, Potassium, Sulfur, and Manganese; toxic elements such as Cadmium, Lead, or Arsenic; or potentially toxic elements, such as Chromium [30-36].
The analysis of Iodine excludes the use of an oxidizing acid for digesting biological samples -which is a usual procedure in multielemental studies [37-38]-, otherwise, Iodine would be oxidized to elemental Iodine, which would be lost by volatilization [39]. An alkali solubilization by using tetramethylammonium hydroxide (TMAH) constitutes a good choice for rapidly dissolving biological samples (liquid samples such as blood or milk, soft tissues –mainly organ or skin samples-, and hard tissues such as hair or nails) prior to ICP-MS analysis of Iodine, among other elements of interest [39-46]. Although acidity is usually needed to obtain a good metal recovery, this can be overcome in an alkaline medium by adding a strong complexing agent that forms stable complexes [47-49], such as ethylenediaminetetraacetic acid (EDTA). In order to get an efficient formation of complexes with EDTA, a pH value higher than 10 is needed [42,50]. Furthermore, it has to be considered that after a TMAH extraction, samples will be partially digested, and then, the residual carbon in their matrix might affect the ionization of Iodine and other elements, causing a bias for concentration measurements [51]. This residual carbon strongly affects –positively or negatively- the emission signal of atomic lines, but the emission signal of ionic lines is mostly unaffected. Thus, ionic lines are usually selected in ICP-OES analysis to maximize detection capabilities due to their higher sensitivity than atomic ones. Nevertheless, atomic lines are most sensitive for certain elements such as Cu, I, P, S, Se and Zn [52]. Regarding these elements, carbon matrix effects on the emission final of their atomic lines are positive for I, P and Se (signal enhancement), negative (signal suppression) for S, and negligible for Cu and Zn [52]. Regarding ICP-MS analysis, it is well known that the addition of Carbon-based compounds causes a signal enhancement of elements with ionization potential in the range of 9-11 eV-such as P, Zn or Se-, of low mass elements-such as Mg and Ca-, and transition metal elements-such as Mn, Fe and Cu-, whereas for elements with ultra-high first ionization potential-such as S and Br- such addition caused a limited signal enhancement effect [53]. Particularly for Iodine, residual carbon increases its ionization. Due to all this, different researchers added compounds such as isopropanol when analyzing Iodine among other elements in food or biological samples [49,51]. Furthermore, some protocols include the addition of a surfactant, such as Triton X-100, for membrane protein solubilization and dispersion [48,49].
Taking into account the uniqueness and the small sizes of the thyroid biopsies, a method is needed that allows analyzing the greatest number of elements, including Iodine, in these tissues, instead of using different methods for sample processing depending on the element of interest. Thus, the US Food and Drug Administration (FDA) method for Iodine determination in food samples [51,54] was considered and adapted for the simultaneous determination of the essential elements Br, Ca, Cu, Fe, I, Mg, Mn, P, S, Se, and Zn in small-sized biopsies by ICP-MS and ICP-OES. Samples were solubilized by using tetramethylammonium hydroxide (TMAH). A mixture of ethylenediaminetetraacetic acid (EDTA), isopropanol, and Triton X-100 was added afterwards. Finally, extracts were analyzed by ICP-MS and ICP-OES. Results were statistically analyzed in order to study element trends and correlations.
Reagents and instrumentation
A TMAH solution 25% in water (Acros Organics), Isopropanol (HPLC-grade Prolabo), and Na2EDTA 99% (Sigma) were used in this study to prepare standards and samples. A TMAH stock solution was prepared by diluting 1/10 (v/v) the TMAH (25%) in Milli-Q water. The standard stock solution ICP Multi Element Standard Certipur® VI was purchased from Merck (Darmstadt, Germany). Monoelemental solutions of target elements and internal standard elements were obtained from VWR. Iodine (KI) standard solution (1000 mg L-1)
and Bromide (100 mg L-1 mixed anion) standard solution were supplied by CPAchem. All solutions were prepared using deionized water (18.3 MΩ) from a Milli-Q purification system (Millipore, Molsheim, France).
Samples and reference material
Biological samples – a fragment from a total thyroidectomy each- were supplied by the Pathological Anatomy Service of the Álvaro Cunqueiro Hospital of the University Hospital Complex of Vigo (Vigo, Galicia, NW of Spain). They consisted of forty six samples from patients diagnosed with benign diseases. Patients’ ages ranged from 25 to 87 years old, with 80% being females. Diagnostic characteristics are summarized in Table 1.
| Table 1: Characteristics analyzed in the thyroidectomy samples. | |
| Number of Biopsies | 46 |
| Age | 58±15 yr (25-87 yr) |
| Gender | |
| Male | 9 (2 TC) |
| Female | 37 (13 TC) |
| Thyroid dysfunctions | |
| Goiter (G) | 33 (71.7 %) |
| Diffuse Goiter (DG) | 10 (3 TC) |
| Nodular Goiter (NG) | 23 (8 TC) |
| Autoimmune diseases (AITD) | 13 (28.3 %) |
| Hyperthyroidism-OTG (Graves´) | 8 (1 TC) |
| Hypothyroidism-CLT (Hashimoto) | 5 (3 TC) |
| TC: Thyroid Cancer | |
Samples were classified according to the kind of thyroid dysfunction as goiter -diffuse or nodular- or AITD - Graves or Hashimoto. Among all these samples, fifteen presented incidental microscopic malignant tissue (thyroid cancer-TC).
Analytical method validation was performed by analyzing the following certified reference materials (n = 5): The Standard Reference Material (SRM) 1549 -non-fat Milk Powder- produced by the National Institute of Standards and Technology (NIST), with certified values for all target elements except Br (with indicative value). In addition, the European Reference Materials ERM-BB422 -fish muscle- and ERM-CR278k –mussel tissue- from the Institute for Reference Materials and Measurements (IRMM); and the NRCC-DORM-3 –fish protein- from the National Research Council of Canada were also considered (with certified values for Cu, Zn, Se, and I or Fe) for ICP-MS analysis. Milk and/or seafood reference materials have usually been selected in studies on biological/food materials (especially in solid samples) after TMAH extraction not only for Iodine determination [39,41,46,51, 55] but also for trace element analysis [43,47,49,56]. This is due to the fact that seafood or milk constitute complex matrices: fish main components (dry basis) are lipids and proteins, while carbohydrate content is very low [57]; mussel composition shows a higher protein and carbohydrate content [58]; and skimmed milk main constituents (dry basis) are carbohydrates and proteins, with very low lipid content [59].
Sample pretreatment
All target samples were cryogenically stored at -80ºC. They were freeze-dried before analysis. Their total dry weight varied from 50 to 200 mg.
Sample preparation
Thyroid samples were weighed in 15 mL polypropylene FalconTM tubes and then solubilized by adding 1 mL of the prepared TMAH stock solution (25% v/v) per 50 mg of sample. All tubes were closed gas-tight and vigorously manually shaken, vortexed, placed in an ultrasonic bath at 75ºC for thirty minutes, and then placed in a water bath at 80ºC overnight. Final solutions were clear and colored. Following solubilization, all samples were diluted 1:1 with a 0.25% m/v EDTA solution in ultrapure water, vortexed to homogenize the solution, and then stored. After storage, some precipitates could be observed in the same samples some precipitates but they easily redissolved by hand shaking.
SRM subsamples (2 g) were solubilized with TMAH, and then isopropanol and EDTA were added (procedure similar to human samples). The final solution had 3% isopropanol and 0.05% EDTA. Inner standards were added similarly to the target samples. Aliquots of the obtained extracts were analyzed by ICP-MS and ICP-OES.
In the case of ICP-MS analysis, aliquots of 1 mL from target sample extracts were gravimetrically diluted (1/2.5) by adding an internal standard solution of Germanium (20 µg L-1) and Tellurium (100 µg L-1) prepared in 6% (v/v) isopropanol in ultrapure water and 0.1% Triton. An additional 100-fold or even a higher dilution was performed on the samples in order to obtain Iodine concentrations within the analytical calibration curve range.
In the case of ICP-OES analysis, aliquots of 1 mL from target sample extracts were gravimetrically diluted (1/2.5) by adding an internal standard solution of Germanium (50 mg L-1), Indium (50 mg L-1), and Scandium (2 mg L-1) prepared in 6% (v/v) isopropanol in ultrapure water, and 0.1% Triton.
Elemental determination
Based on the instrumental analytical advantages, precision, sensitivity, and the expected range of concentrations for the elements of interest, Bromine, Copper, Iodine, Manganese, and Selenium were determined by ICP-MS; Calcium, Iron, Magnesium, Phosphorus, and Sulfur, by ICP-OES; and Zinc, by both techniques. Zinc was used to check outliers: those samples presenting an anomalous deviation (ratio <0.9) between both techniques would be measured again. Nevertheless, no outliers were found.
Six-point calibration curves -blank included- were prepared by serial dilution in 1% TMAH and 0.1 % EDTA elemental working stock solutions. Elemental concentrations were determined using external standardization and linear regression through the blank. Internal standards were gravimetrically mixed 1/2.5 with the blanks, standards, and samples. A 2 min rinse between samples with a 3% isopropanol, 1% TMAH, 0.1% EDTA, and 0.01% Triton X-100 solution ensured that elemental signals were down to background levels after analyzing a sample with 100 ng g−1 of Iodine. Such rinsing also avoids sudden changes in the matrix that could alter the conditions of the plasma. The high Iodine content in thyroid tissue makes it necessary to separate its measurement from the other trace elements.
ICP-MS: Analysis by ICP-MS was performed in a Thermo X7 Series Quadrupole Mass Spectrometer equipped with a collision/reaction cell, a 0.4 mL concentric quartz nebulizer, a Peltier-cooled (2ºC) silica impact bead spray chamber, and a standard silica torch. A standard nickel sampler and skimmer cones were used. The equipment was operated in collision/reaction mode using Helium/Hydrogen combined with kinetic energy discrimination in order to overcome spectral interferences caused by polyatomic, doubly charged, or isobaric ions. Thus, a solution of 50 µg L-1 of Selenium and 10 µg L-1 of Germanium prepared in 1% TMAH and 3% isopropanol v/v was used to check the background equivalent concentration (BEC) and signal stability on the isotopes 78Se+ and 72Ge+ (m/q). Instrumental conditions are summarized in Table 2. Calibration curves for target sample analyses were prepared from monoelemental stock solutions.
| Table 2: Instrumental settings for ICP-MS. | |||||||
| ICP-MS | |||||||
| Element | Mn | Cu | Zn | Se | Br | I | |
| m/z | 55+ | 65+ | 66+ | 78+ | 79+ | 127+ | |
| Internal standard | 72Ge+ | 72Ge+ | 72Ge+ | 72Ge+ | 72Ge+ | 125Te+ | |
| Slope | cps/(µg L-1) | ≈ 8000 | ≈ 3000 | ≈ 2000 | ≈ 1100 | ≈ 400 | ≈ 10000 |
Internal standardization was used to correct for instrument instability, signal drift and/or the existence of non-spectral interferences (suppression or enhancement of the signal caused by the matrix). 72Ge was used as internal standard. Reference materials were used to test the recovery percentage of the procedure for each considered element (55Mn, 65Cu, 66Zn, and 78Se, 79Br and 127I).
ICP-OES: Analysis by ICP-OES was performed in a Thermo ScientificTM iCAPTM PRO XP ICP-OES Duo model, with radial and axial configuration. This instrument consists of a Charge Injection Device (CID) detector and an Echelle spectrometer, a peristaltic pump, a 0.4 mL concentric quartz nebulizer, a silica cyclonic spray chamber, and a standard silica torch. Instrument operating conditions were according to the manufacturer’s “organic mode” settings. Internal standardization was also used (Ge, In, and Sc). The reference material SRM1549 (non-fat milk SRM1549) was used to test the recovery percentage of the procedure for each considered element (Mg, P, S, Ca, Fe and Zn). Instrumental conditions are summarized in Table 3.
| Table 3: Instrumental settings for ICP-OES. | |||||||
| ICP-OES | |||||||
| Element | Mg (a) | P (a) | S (a) | Ca (i) | Fe (i) | Zn (i) | |
| Wavelength (nm) | 285.213 | 185.942 | 182.034 | 317.933 | 238.204 | 206.200 | |
| Plasma view | Radial | Axial | Axial | Radial | Axial | Axial | |
| Internal Standard | Sc 361.384 (i) | Ge 209.426 (a) | In 230.606 | Sc 361.384 (i) | In 230.606 (i) | Ge 209.426 (i) | |
| Slope | cps/ (mg L-1) | ≈ 800 | ≈ 100 | ≈ 100 | ≈ 500 | ≈ 6000 | ≈ 4000 |
Figures of merit/analytical performance
The method’s accuracy, precision and linearity were examined. To verify the accuracy of the method, the certified materials (SRM 1549) were analyzed in quintuplicate (n=5) at a minimum, on at least two different days. Additionally, spiked samples with Selenium (for ICP-MS analyses) and Iron (for ICP-OES analyses) were also analyzed. An additional 100-fold or even a higher dilution was performed on the samples in order to obtain Iodine concentrations within the analytical calibration curve range. It’s also advisable to change the peristaltic tubing and clean the instrument components. The precision of the method for ICP-MS, expressed as relative standard deviation (RSD), was evaluated in terms of repeatability on the SRM1549.
Limits of detection (LD) and quantification (LQ) were determined following the 3σ and 10σ criteria, respectively, using the standard deviation (σ) of 10 blank measurements. LD was calculated as 3SDb/m, while LQ was calculated as 10SDb/m, where “m” corresponds to the slope of the calibration curve. Calibration curves were built from five replicate measurements.
Sample data treatment: Statistical analysis
Statistical data analysis was performed with GraphPad Prism 8.1. The Shapiro-Wilk test was applied to verify if data were normally distributed. Then, raw data were log-transformed. The study includes: 1) descriptive statistical data: average, median and range values for all variables (it was also calculated the ratio (Δ) between the mean values of two groups, and the similarity between them: the lower the p-value the higher the difference in the element content); 2) unpaired t-test on logarithmically transformed data to find significant differences between groups considering two tailed α = 0.05; and 3) univariate correlation analysis (Pearson’s r correlation matrix) on log-transformed data. Statistical analyses were performed considering a selection of the following groups: 1) all samples (n=47); 2) males (M); 3) females (F); 4) Goiter (G) samples; 5) AIDT samples; 6) diffuse goiter (DG) samples; 7) nodular goiter (NG) samples; 8) OTG samples; 9) CLT samples; 10) thyroid cancer (TC) samples; 11) non-cancerigenous (NC) samples; 12) NC-G; 13) NC-AIDT; 14) TC-AIDT; 15) TC-G; 16) NC-DG; 17) NC-NG; 18) NC-OTG; and 19) NC-CLT.
Figures of merit
Figures of merit and both instrumental and procedural LD and LQ values for dry tissue samples are shown in Tables 4 and 5. Regression coefficients of calibration curves were higher than 0.9995. Recoveries for certified elements ranged from 90 to 99% for ICP-MS analysis for reference material SRM-1549 (Table 4). Recoveries for certified elements in the other reference materials considered ranged from 83 to 85% for Mn, from 91 to 101% for Cu, from 85 to 98% for Zn, and from 99 to 102% for Se for ICP-MS analysis. Recoveries for certified elements ranged from 93 to 105 % for ICP-OES analysis for reference material SRM-1549 (Table 5). This highlights a high method accuracy. RSDs from five independent solubilizations ranged from 2.7% to 7.1% for all elements by ICP-MS, while they ranged from 0.9 to 3.7% for all elements by ICP-OES.
| Table 4: Figures of merit for ICP-MS analysis | |||||||
| ICP-MS | |||||||
| Element: Selected m/q+ | 55Mn | 65Cu | 66Zn | 78Se | 79Br | 127I | |
| Linearity | r2 | >0.9995 | >0.9995 | >0.9995 | >0.9995 | >0.9995 | >0.9995 |
| Calibration Range | µg L-1 | 2-50 | 5-100 | 10-500 | 2-50 | 10-200 | 5-100 |
| Recovery (SRM)* | % (n=5) | 91.9 | 90.2 | 95.3 | 98.5 | 107** | 96.8 |
| RSD (SRM) | % (n=5) | 6.8 | 4.3 | 3.6 | 7.1 | 4.3 | 2.7 |
| LDa | µg L-1 | 0.2 | 0.5 | 2.4 | 0.2 | 2.6 | 0.6 |
| LQb | µg L-1 | 0.4 | 1.5 | 5.4 | 0.6 | 8.5 | 1.3 |
| MLDc | mg kg-1 | 0.02 | 0.05 | 0.24 | 0.02 | 0.26 | 0.06 |
| MLQd | mg kg-1 | 0.04 | 0.15 | 0.54 | 0.06 | 0.85 | 0.13 |
| a: instrument LD in aqueous solutions; b: instrument LQ in aqueous solutions; c: method LD in solid samples; d: method LQ in solid samples. * SRM-1546; **From information value |
|||||||
| Table 5: Figures of merit for ICP-OES analysis. | |||||||
| ICP-OES | |||||||
| Element | Mg (I) | P (I) | S (I) | Ca (II) | Fe (II) | Zn (II) | |
| Linearity | r2 | >0.9995 | >0.9995 | >0.9995 | >0.9995 | >0.9995 | >0.9995 |
| Calibration Range | mg L-1 | 5-50 | 5-200 | 5-200 | 5-100 | 0.2-5 | 0.2-5 |
| Recovery (SRM)* | % (n=5) | 104.2 | 100.1 | 101.3 | 97.6 | 93.1 | 105.1 |
| RSD (SRM) | % (n=5) | 1.0 | 1.1 | 0.9 | 1.0 | 3.7 | 1.6 |
| LDa | mg L-1 | 0.02 | 0.12 | 0.4 | 0.03 | 0.01 | 0.02 |
| LQb | mg L-1 | 0.05 | 0.20 | 0.5 | 0.05 | 0.03 | 0.06 |
| LDc | mg Kg-1 | 0.2 | 12 | 40 | 3.0 | 0.9 | 2.2 |
| LQd | mg Kg-1 | 0.5 | 20 | 50 | 5.0 | 2.6 | 6.4 |
| a:instrument LD in aqueous solutions; b: instrument LQ in aqueous solutions; c: method LD in solid samples; d: method LQ in solid samples. *SRM-1546 | |||||||
Results are in concordance with different studies where environmental samples and SRM were analyzed after alkaline extraction and promotion of metal complex formation with EDTA. Such investigations showed good recoveries in SRM for metals such as Br, Ca, Cu, Fe, I, Mg, Mn, P, Se or Zn [47,49,50].
Thyroid biopsies
Element concentrations in thyroid samples showed that the most abundant element, considering average values in this kind of tissue, is S, followed by P, Ca, and I. Iron, Mg, and Zn appeared as traces, while Cu, Br, Se, and Mn were detected in even smaller concentrations (Table 6).
| Table 6: Average age, element contents and range (µg g-1) for all samples and different considered groups (G: goiter; DG: diffuse goiter; NG: diffuse goiter; AIDT: Autoinmune thyroid disease; OTG: overactive thyroid gland; CLT: chronic lymphocytic thyroiditis; NC: non-cangerigenous; TC: thyroid cancer; F: females; M: males). | |||||||||||
| All n=46 |
G n=33 |
DG n=10 |
NG n=23 |
AIDT n=13 |
OTG n=8 |
CLT n=5 |
NC n=31 |
TC n=15 |
F n=37 |
M n=9 |
|
| Age (yr) |
58±15 (25-87) |
62±13 (40-85) |
60±16 (40-85) |
62±12 (40-82) |
49±17 (25-87) |
41±13 (25-57) |
60±17 (45-87) |
58±17 (25-87) |
59±12 (40-81) |
58±16 (25-87) |
58±13 (32-74) |
| Br | 4.2±2.0 (1.3-10.0) |
4.3±1.9 (1.3-10.0) |
4.8±2.6 (2.0-10.0) |
4.1±1.6 (1.3-7.9) |
4.0±2.2 (1.5-9.3) |
4.0±2.6 (1.8-93) |
4.1±1.5 (1.5-4.9) |
4.3±2.2 (1.3-10.0) |
4.2± 1.4 (1.5-7.3) |
4.4±2.1 (1.4-10.0) |
3.7±1.3 (1.3-5.5) |
| Ca | 1504±1020 (424-4687) |
1726±1087 (444-4687) |
1662±897 (456-3111) |
1754±1178 (444-4687) |
940±521 (424-2095) |
835±415 (437-1718) |
1108±674 (424-2095) |
1519±1090 (437-4687) |
1472±894 (424-3262) |
1445±1036 (424-4687) |
1745±972 (723-4000) |
| Cu | 4.8±2.1 (1.5-11.1) |
4.9±2.3 (1.7-11.1) |
5.4±3.2 (2.0-10.6) |
4.7±1.8 (1.7-11.1) |
4.3±1.3 (1.5-6.5) |
4.2±0.7 (3.1-5.0) |
4.6±2.0 (1.5-6.5) |
4.7±1.8 (1.7-10.6) |
5.0±2.7 (1.5-11.1) |
4.9±2.2 (1.5-11.1) |
4.3±1.7 (1.7-6.5) |
| Fe | 308±200 (54-840) |
300±183 (54-801) |
325±225 (54-700) |
290±170 (63-801) |
327±241 (58-840) |
293±244 (58-840) |
382±253 (148-815) |
295±227 (54-840) |
336±132 (148-700) |
309±189 (54-840) |
306±253 (58-801) |
| I | 1511±1399 (105-5435) |
1917±1451 (105-5435) |
1912±1434 (312-5435) |
1919±1434 (105-4877) |
479±343 (134-1341) |
556±371 (134-1341) |
355±284 (137-850) |
1417±1367 (134-5435) |
1705±1491 (105-4326) |
1562±1432 (105-5435) |
1298±1311 (134-3849) |
| Mg | 229±68 (122-428) |
226±68 (139-428) |
213±73 (144-373) |
232±66 (139-428) |
236±72 (122-382) |
228±82 (122-382) |
248±60 (156-295) |
241±75 (122-428) |
204±45 (144-295) |
227±65 (122-382) |
237±83 (144-428) |
| Mn | 1.1±0.6 (0.2-2.7) |
1.0±0.5 (0.2-2.7) |
1.0±0.8 (0.2-2.7) |
1.0±0.3 (0.2-1.4) |
1.4±0.6 (0.3-2.5) |
1.5±0.6 (0.5-2.5) |
1.3±0.7 (0.3-2.1) |
1.1±0.6 (0.2-2.7) |
1.1±0.7 (0.3-2.5) |
1.1±0.6 (0.2-2.7) |
1.1±0.4 (0.4-1.7) |
| P | 5617±1960 (2781-11190) |
5239±1775 (2781-9917) |
5354±2210 (3359-9917) |
5189±1605 (2781-8133) |
6578±2149 (3128-11190) |
6289±2367 (3128-11190) |
7039±1901 (4578-9697) |
5682±2063 (2781-11190) |
5485±1790 (3359-9697) |
5752±1992 (2852-11190) |
5063±1823 (2781-7901) |
| S | 12248±3474 (5252-24227) |
12904±3687 (5252-24227) |
12535±5306 (5252- 4227) |
13065±2858 (7321-18794) |
10582±2195 (6825-14579) |
9948±1973 (6825-13363) |
11597±2357 (8632-14579) |
12045±3257 (5252-18794) |
12668±3973 (8632-24227) |
12399±3753 (5252-24227) |
11628±1992 (9709-14819) |
| Se | 1.8±1.2 (0.4-5.4) |
2.1±1.3 (0.4-5.4) |
2.1±1.5 (0.6-4.9) |
2.1±1.3 (0.4-5.4) |
1.0±0.5 (0.5-2.2) |
0.9±0.3 (0.5-1.4) |
1.2±0.6 (0.5-2.2) |
1.7±1.3 (0.4-5.4) |
2.0±1.1 (0.5-3.8) |
1.8±1.3 (0.5-5.4) |
1.5±0.9 (0.4-3.1) |
| Zn | 124±62 (47-282) |
134±65 (56-282) |
128±67 (68-270) |
136±66 (56-282) |
98±46 (47-221) |
99±54 (59-221) |
96±37 (47-133) |
137±68 (59-282) |
97±35 (47-176) |
119±62 (47-282) |
143±62 (84-231) |
Results of an unpaired parametric test on element data considering average values are shown in Table 7. Similar results for this test were obtained when considering median instead of average element concentrations. Goiter samples showed higher contents of I (×4.0), Se (×2.0), Ca (×1.8), Zn (×1.4), and S (×1.2), and lower contents of Mn (×0.68) and P (×0.80) than AIDT samples. These differences were statistically significant. This was also observed, except for P, when non-cancerigenous-goiter versus non-cancerigenous-AIDT samples were considered (ratios very similar to the former comparison). Regarding Goiter samples, DG and NG tissues showed element contents of the same order (statistically significant differences were not detected), and NC-DG and NC-NG too. In the case of AIDT samples, OTG and CLT tissues showed similar element contents for all elements (statistically significant differences were not detected), and NC-OTC and NC-CLT too. Regarding thyroid cancer samples versus non-cancerigenous samples, statistically significantly lower contents of Zn (×0.71) and Mg (×0.85) were detected in malignant samples. This was also observed when cancerigenous versus non-cancerigenous-goiter samples were considered. No significant differences were detected for element concentrations between malignant and benign samples in the AIDT-group (TC-AIDT vs NC-AIDT). Neither statistically significant differences were detected when differentiating by gender (Table 7).
| Table 7: Ratio value (Δ) for each considered group considered in the unpaired t-test and its corresponding p-value. | ||||||||||||
| Element | Gender | Malignancy | Goiter | AITD | Goiter vs AIDT | |||||||
| F/M | TC/NC | TC-G/ /NC-G | TC-AIDT/ NC-AIDT | DG/ NG | NC-DG/ NC-NG |
OTG/ CLT |
NC-OTG/ NC-CLT | G/ AITD |
NC-G/ NC-AIDT | NC-G/ NC-OTG | ||
| Br | Δ | 1.18 | 0.98 | 1.05 | 0.81 | 1.15 | 1.21 | 0.98 | 0.86 | 1.07 | 0.99 | 1.02 |
| p | 0.37 | 0.91 | 0.78 | 0.55 | 0.39 | 0.41 | 0.96 | 0.75 | 0.68 | 0.95 | 0.93 | |
| Ca | Δ | 0.83 | 0.97 | 1.03 | 0.87 | 0.95 | 0.86 | 0.75 | 0.58 | 1.84** | 1.78** | 2.07** |
| p | 0.43 | 0.88 | 0.92 | 0.71 | 0.82 | 0.66 | 0.38 | 0.20 | <0.01 | 0.02 | <0.01 | |
| Cu | Δ | 1.12 | 1.00 | 1.12 | 0.91 | 1.15 | 1.26 | 0.92 | 0.80 | 1.15 | 1.08 | 1.14 |
| p | 0.50 | 0.64 | 0.52 | 0.62 | 0.53 | 0.34 | 0.70 | 0.22 | 0.23 | 0.62 | 0.27 | |
| Fe | Δ | 1.01 | 1.14 | 1.29 | 0.83 | 1.12 | 0.96 | 0.77 | 0.51 | 0.92 | 0.79 | 0.96 |
| p | 0.97 | 0.45 | 0.26 | 0.70 | 0.63 | 0.91 | 0.54 | 0.26 | 0.69 | 0.44 | 0.91 | |
| I | Δ | 1.20 | 1.20 | 1.22 | 0.75 | 1.00 | 0.95 | 1.57 | 1.06 | 4.00** | 3.44** | 3.40** |
| p | 0.62 | 0.52 | 0.47 | 0.56 | 0.99 | 0.89 | 0.32 | 0.93 | <0.01 | <0.01 | <0.01 | |
| Mg | Δ | 0.96 | 0.85* | 0.82** | 0.93 | 0.92 | 0.96 | 0.92 | 0.92 | 0.96 | 1.00 | 1.02 |
| p | 0.70 | 0.09 | 0.03 | 0.70 | 0.47 | 0.76 | 0.65 | 0.76 | 0.68 | 1.0 | 0.90 | |
| Mn | Δ | 1.03 | 0.98 | 0.95 | 1.07 | 1.07 | 1.01 | 1.14 | 0.88 | 0.68** | 0.70* | 0.73 |
| p | 0.88 | 0.93 | 0.82 | 0.80 | 0.82 | 0.97 | 0.63 | 0.67 | 0.02 | 0.06 | 0.13 | |
| P | Δ | 1.14 | 0.97 | 0.93 | 1.05 | 1.03 | 1.03 | 0.89 | 0.99 | 0.80** | 0.83 | 0.83 |
| p | 0.35 | 0.75 | 0.60 | 0.81 | 0.81 | 0.85 | 0.56 | 0.98 | 0.04 | 0.18 | 0.24 | |
| S | Δ | 1.07 | 1.05 | 1.03 | 1.11 | 0.96 | 0.87 | 0.86 | 0.93 | 1.22** | 1.25** | 1.27* |
| p | 0.56 | 0.57 | 0.80 | 0.40 | 0.77 | 0.28 | 0.20 | 0.65 | 0.04 | 0.04 | 0.06 | |
| Se | Δ | 1.19 | 1.20 | 1.16 | 1.20 | 0.99 | 0.82 | 0.77 | 0.83 | 2.03** | 2.06** | 2.16** |
| p | 0.52 | 0.44 | 0.53 | 0.50 | 0.97 | 0.58 | 0.33 | 0.50 | <0.01 | <0.01 | <0.01 | |
| Zn | Δ | 0.83 | 0.71** | 0.67** | 0.84 | 0.94 | 0.90 | 1.03 | 0.87 | 1.37* | 1.47* | 1.37* |
| p | 0.30 | 0.01 | 0.01 | 0.59 | 0.76 | 0.64 | 0.92 | 0.74 | 0.07 | 0.08 | 0.09 | |
| *Statistically significant p-values (p<0.1) **Statistically significant p-values (p<0.05) F: female samples; M: male samples; TC: thyroid cancer samples; NC: non-cancerigenous samples; DG: diffuse goiter samples; NG: nodular goiter samples; OTG: overactive thyroid gland samples; CLT: chronic lymphocytic thyroiditis samples; AIDT: autoimmune thyroid diseases samples |
||||||||||||
Element concentrations reported in the literature for thyroid tissue display a large variability (Tables 8 and 9). Many of these variations can be attributed to different factors such as diet, environment, age, hormonal status, and thyroid disorders. Element levels found in the present study are similar to those described in other investigations (Tables 8 and 9). A higher bromine content in thyroid samples from Russian patients was related to the use of Br compounds as sedatives [60-62].
| Table 8: Element contents (µg g-1) in goiter (G) and autoimmune thyroid diseases (AIDT) tissues (NG: nodular goiter; CNG: colloid nodular goiter; MNG: multinodular goiter; OTG: overactive thyroid gland; CLT: chronic lymphocytic thyroiditis; F: females). | |||||||||||||
| Br | Ca | Cu | Fe | I | Mg | Mn | P | S | Se | Zn | Country | Reference | |
| G n=33 (61±13 yr) |
4.2±1.9 | 1685±1096 | 4.9±2.3 | 300±183 | 1884±1442 | 224±68 | 1.0±0.5 | 5195±1767 | 12690±3840 | 2.0±1.3 | 132±65 | Spain | This work |
| NG n=65 (Average 35 yr) |
- | - | 3.35±0.93 | 201.59±23.45 | - | - | 0.40±0.22 | - | - | - | 41.83±7.19 | Poland | [89] |
| NG n=41 |
- | - | 2.82±0.62 | - | - | - | - | - | - | 1.49±0.34 | 38.3±2.2 | Poland | [29] |
| MNG n=130 |
- | - | 0.26 (0.10-1.61) |
- | - | - | 0.088 (0.02-0.34) |
- | - | 0.08 (0.02-0.42) |
5.60 (1.18-22.6) |
Serbia | [81] |
| CNG n=46 (48±12 yr) |
36.3±31.3 | 1393±855 | 8.51±7.15 | 324±309 | 1144±943 | 351±148 | 1.78±1.13 | - | - | 3.09±2.59 | 119±53.1 | Russia | [62, 65] |
| CNGa n=16 |
42.2±23.3 | 1455±999 | - | - | 1587±1087 | 345±158 | 1.35±0.68 | - | - | - | - | Russia | [ 90] |
| CNGb n=13 |
19.4±7.1 | 1152±610 | - | - | 762±600 | 328±134 | 2.40±1.70 | - | - | - | - | Russia | [90] |
| AIDT n=12 (39±9 yr) |
85±35 | 694±421 | 5.05±0.21 | 222±181 | 662±604 | 514±232 | 2.33±1.72 | - | - | 1.82±0.45 | 91.4±28.9 | Russia | [65] |
| AIDT-OTG n=8 (41±13 yr) |
4.0±2.6 | 835±415 | 4.2±0.7 | 293±244 | 556±371 | 228±82 | 1.5±0.6 | 6289±2367 | 9948±1973 | 0.9±0.3 | 99±54 | Spain | This work |
| AIDT-OTG n=18 |
- | - | 2.42±0.32 | - | - | - | - | - | - | 1.47±0.38 | 41.7±3.8 | Poland | [29] |
| AIDT-CLT n=5 (60±17 yr) |
4.1±1.5 | 1108±674 | 4.6±2.0 | 382±253 | 355±284 | 248±60 | 1.3±0.7 | 7039±1901 | 11597±2357 | 1.2±0.6 | 96±37 | Spain | This work |
| AIDT-CLT n=31 |
- | - | 0.42* (0.15-1.27) |
- | - | - | 0.19* (0.06-0.48) |
- | - | 0.10* (0.04-0.22) |
5.59* (1.95-17.6) |
Serbia | [81] |
| a: macrofollicular b: microfollicular *: Median values |
|||||||||||||
| Table 9: Element contents (µg g-1) in thyroid cancer (TC) and normal thyroid (NT) tissues (F: females; M; males). | |||||||||||||
| Br | Ca | Cu | Fe | I | Mg | Mn | P | S | Se | Zn | Country | Reference | |
| TC n=15 (59±12 yr) |
4.2±1.4 | 1472±894 | 5.0±2.7 | 336±132 | 1705±1491 | 204±45 | 1.1±0.7 | 5485±1790 | 12668±3973 | 2.0±1.1 | 9±35 | Spain | This work |
| TC n=41 (46±15 yr) |
139±203 | 3013±2966 | 14.5±9.4 | 255±168 | 71.8±62.0 | 478±194 | 2.01±1.34 | 10493±3238 | 9448±1605 | - | 96.9±80.0 | Russia | [60,61] |
| TC n=21 |
- | - | 2.65±0.31 | - | - | - | - | - | - | 0.88±0.11 | 23.1±3.6 | Poland | [29] |
| TCa n=10 (Me:53 yr) |
- | - | 3.96* | 25.5* | - | - | 0.17* | - | - | - | 9.60* | Serbia | [74] |
| TCb n=16 (Me:23 yr) |
- | - | 3.25* | 32.6* | - | - | 0.18* | - | - | - | 11.1* | Serbia | [74] |
| TC n=85 |
- | - | 0.36* (0.09-1.66) |
- | - | - | 0.14* (0.03-0.60) |
- | - | 0.07* (0.01-0.22) |
5.65* (1.63-6.41) |
Serbia | [81] |
| TC n=45 (33±8 yr) |
- | - | 1.4±0.5 | 79±40 | - | 79±21 | 0.42±0.25 | - | - | 0.51±0.21 | 29±11 | Kuwait | [83] |
| TC n=4 |
17±8 | 1433±2384 | 10±7 | 61±45 | 97±81 | - | - | - | - | - | 46±17 | Japan | [71] |
| NT n=50 (Average 25 yr) |
- | - | 5.24±0.51 | 241.44±21.96 | - | - | 0.68±0.10 | - | - | - | 101.30±10.90 | Poland | [89] |
| NT n=17 (21-77 yr) |
- | - | ~2* | ~100* | - | - | ~0.4* | - | - | - | ~42* | Serbia | [74] |
| NT n=131 recogidos al lado del tumor |
- | - | 0.34* (0.11-2.02) |
- | - | - | 0.12* (0.03-0.40) |
- | - | 0.15* (0.03-0.50) |
5.88* (1.32-11.4) |
Serbia | [81] |
| NT n=105 (44±21 yr) |
14.9±11.0 | 1682±999 | 4.08±1.22 | 223±95 | 1841±1027 | 296±134 | 1.28±0.56 | 4290±1578 | 8259±2002 | - | - | Russia | [60] |
| NT n=105 (44±21 yr) |
14.9±11.0 | 1711±1022 | 4.23±1.52 | 223±93 | 1841±1027 | 285±139 | 1.35±0.54 | - | - | 2.32±1.29 | 105.1±40.1 | Russia | [62] |
| NT n=45 (33±8 yr) Tejido al lado del tumor |
- | - | 1.2±0.4 | 84±38 | - | 76±20 | 0.31±0.15 | - | - | 0.49±0.24 | 32.0±10.8 | Kuwait | [83] |
| NT n=4 |
17±7 | 933±324 | 9±2 | 248±29 | 1900±572 | - | - | - | - | - | 67±20 | Japan | [71] |
| NT n=72 M (2-80 yr) |
13.7±7.8 | 1703±1048 | - | - | - | 306±143 | 1.31±0.49 | - | - | - | - | Russia | [85] |
| NT n=71 M (2-80 yr) |
10.8±10 | - | 4.25±1.48 | 221±102 | - | - | - | - | - | - | 122±41 | Russia | [86] |
| NT n=73 M (2-80 yr) |
- | - | - | 222±96 | 1486±902 | - | - | - | - | 2.36±1.34 | 103±43 | Russia | [88] |
| NT n=36 M (£35 yr) |
8.79±9.2 | - | 3.93±1.6 | 222±108 | - | - | - | - | - | - | 112±42 | Russia | [86] |
| NT n=44 M (£40 yr) |
12.5±8.6 | 1484±597 | - | - | 1601±968 | 309±126 | 1.46±0.60 | - | - | - | - | Russia | [85] |
| NT n=35 M (>35 yr) |
12.6±11.8 | - | 4.58±1.66 | 221±106 | - | - | - | - | - | - | 135±41 | Russia | [86] |
| NT n=28 M (>40 yr) |
15.4±9.0 | 2003±1471 | - | - | 2048±1005 | 301±206 | 1.11±0.42 | - | - | - | - | Russia | [85] |
| NT n=33 F (4-87 yr) |
22.4±16.2 | 1630±1071 | 3.40±1.41 | 225±98 | 1956±1199 | 230±105 | 1.32±0.84 | 3860±2175 | 6579±2662 | - | 83.2±41.2 | Russia | [38] |
| NT n=33 F (4-87 yr) |
- | - | - | 232±112 | 1751±1169 | - | - | - | - | 2.22±1.19 | 85.7±38.0 | Russia | [87] |
| NT n=11 F (£40 yr) |
13.3±8.3 | 1052±216 | 1876±1148 | 212±129 | 1.43±0.43 | Russia | [85] | ||||||
| NT n=11 F (£40 yr) |
13.3±8.3 | 945±302 | 2.94±1.49 | 174±83 | 1876±1148 | 234±136 | 1.21±0.46 | 3247±2793 | 6049±3695 | - | 56.8±35.2 | Russia | [38] |
| NT n=22 F (>40 yr) |
26.8±20.2 | 2042±1412 | 4.17±2.20 | 264±117 | 2002±1351 | 225±164 | 1.45±2.11 | 4552±3809 | 7426±3269 | 102.6±42.2 | Russia | [38] | |
| a, b: different size tumours: a)≤20 mm, b) 20-40mm *: Median values |
|||||||||||||
Univariate correlation analyses are summarized in Table 10. Significant inverse correlations were not detected. A very highly significant direct correlation was detected for Mg-P in all considered groups (NC-G, NC-AIDT and TC; r = 0.82-0.96). This could relate to the fact that Mg acts as a metallo-coenzyme in more than 300 phosphate transfer reactions.
Participates in all reactions involving the formation and utilization of ATP [63]. Several significant direct correlations for different pairs of elements were detected mainly for the NC-G group (Table 10), possibly because it was not highly affected by the body element balance in patients with non-cancerigenous goiter. The significant direct correlation found for Cu-Mn in NC-G samples could be related to the fact that these are elements involved in protecting the body against oxidative stress. In addition, certain element imbalances have been described for patients diagnosed with AIDT or with tumors that could be the reason for the lack of correlations obtained for most of the considered pairs of elements (Table 10).
| Table 10: Univariate correlation summarized results considering average log-transformed data for the different groups considered. It is only showed Pearson’s correlation coefficients (r) for significant correlations (p<0.001). Note the different number of samples for each group. |
|||
| Average ratio-log data | NC-Ga (n=22) |
NC-AIDTb (n=9) |
TCc (n=15) |
| Se-I | 0.740 | n.s. | n.s. |
| Se-Br | n.s. | n.s. | n.s. |
| Br-Cu | 0.685 | n.s. | n.s. |
| Br-P | 0.612 | n.s. | n.s. |
| Cu-Mn | 0.802 | n.s. | n.s. |
| Cu-P | 0.664 | n.s. | n.s. |
| Zn-Mg | 0.733 | n.s. | n.s. |
| Zn-P | 0.880 | n.s. | n.s. |
| Ca-Mg | 0.688 | n.s. | n.s. |
| Mg-P | 0.851 | 0.959 | 0.815 |
| n.s: non-significant Correlation is significant when Pearson’s correlation coefficient (r) is higher than 0.652a, 0.898b or 0.760c depending on the degrees of freedom (two tailed test) |
|||
A significant direct correlation was observed for I-Se for NC-G samples (r = 0.740, n = 22). Such a correlation was not detected for NC-AIDT samples (r = 0.282, n = 9). It has been indicated by several researchers that an excessive Iodine intake and a Selenium deficiency may influence thyroid autoimmunity, with an optimum balance between I and Se needed for maintaining a normal thyroid function. An excessive Iodine intake has been related to autoimmune thyroiditis, and it has been suggested that this can induce Hashimoto’s thyroiditis [64]. In patients diagnosed with AIDT, and most particularly in those with Graves’ disease (OTG), a Se deficiency has been detected [8,36,65-67]. This is clearly reflected in the obtained data, where OTG (n = 8) samples showed, on average, lower Se contents than Goiter samples (0.9±0.3 in front of 2.1± 1.3 µg g-1, respectively). Furthermore, great losses of Iodine have been detected in AIDT thyroid tissues and slightly reduced levels in G thyroid tissues [65]. Thus, the Iodine to selenium imbalance in patients diagnosed with AIDT is reflected by the lack of correlation obtained in the AIDT-group of samples for I-Se (Table 10). The pair I-Se is also not correlated for malignant samples, probably for a similar reason (imbalance). In particular, different studies have highlighted a Se deficiency in thyroid cancer patients [17,29, 68], while others have suggested that an Iodine deficiency is a risk factor for thyroid cancer [69] as well as an Iodine excess [70]. Some works indicated a very low I content [60,61,71] in TC tissue.
Average Zn levels were also significantly different when comparing AIDT samples to G samples, being lower in the former, as observed by other researchers [65]. This could be because low Zn contents are associated with hypothyroidism [72]. In addition, Zn contents were significantly different between malignant and benign samples, with lower average levels in TC samples. This is in concordance with several studies where it is described that patients with thyroid cancer have significantly low levels of this essential micronutrient in the thyroid tissue [29,73-74].
Average Ca and P levels were significantly different between AIDT samples and G samples. AIDT samples showed the lowest Ca and the highest P concentrations, related to the fact that in thyroid dysfunction cases, the minerals’ metabolism is altered. These results are in concordance with studies on Ca and P levels in serum samples from patients with hypothyroidism, where hypocalcemia was detected, and high P and Mg levels were detected [75-78]. Hypocalcemia increases renal phosphate reabsorption. In addition, it has been described that a negative balance in the mineral ion homeostatic system for Ca, Mg, or P may occur with diseases such as hyperthyroidism and primary hyperparathyroidism [79]. The high Ca content detected in G samples could be related to the fact that Ca could be goitrogenic when in excess in the diet [23], and also to the fact that thyroid calcification is frequent in thyroid nodules [80]. Calcium, P and Mg homeostasis have been frequently disturbed when thyroid dysfunctions exist. Furthermore, there are studies that indicated an increase in the Ca and P contents in malignant thyroid samples [60,61,71].
In the case of Mn, AIDT samples showed, on average, significantly higher contents than G samples. Similar findings were reported in other studies when considering CLT and G samples [81]. In addition, serum Mn levels were found to be increased in hypothyroidism patients [72]. No differences in Mn content were detected for benign and malignant samples in the present study. Nevertheless, there are studies were it is indicated that Mn content was increased [82], decreased [74], or similar [60-62] to that of benign samples.
Regarding Mg, a significantly lower average concentration was detected in malignant versus benign goiter samples. Some works pointed out lower Mg contents in serum samples from patients diagnosed with TC [83], while in other works, higher Mg contents were detected in TC tissues [60-61].
In the case of S, AIDT samples showed significantly lower contents than G samples. This could be related to the fact that serum levels of H2S (a molecule that promotes the synthesis and secretion of thyroid hormones) are reduced in hypothyroid patients [84].
Regarding Br, Cu and Fe contents , no statistically significant differences were detected among the average contents of the considered groups (Table 7). Bromine is concentrated by the thyroid and interferes with the thyroid I uptake [23]. Its biological behavior is similar to that of Iodine in the thyroid gland because both elements have similar chemical properties. Thus, an enhanced intake of Br could interfere with the metabolism of Iodine at the whole-body level. Zaichik [65]
found elevated Br contents in goiter, AIDT-CLT, and Riedel’s disease samples in comparison with normal thyroid tissues, with the Br content in G samples higher than in AIDT-CLT or Riedel’s disease samples. Furthermore, higher Br levels were indicated in cancerous tissues [60,73] too. In the present study, average Br contents in AIDT-CLT samples and AIDT-OTG samples (4.1±1.5 and 4.0±2.6 µg g-1, respectively) were not statistically different from those of goiter samples (4.3±1.9 µg g-1).
Different studies have indicated a decreased content of Fe in thyroid carcinoma tissues [60,74,82] and an increased level of Cu [60,73,74,82], while others have shown similar contents of Cu and Fe for benign and malignant thyroid nodular tissues [61,62]. In the present study, no differences were detected for Cu or Fe contents among benign and malignant samples.
It should also be considered that a dependence on both age and gender in the content of many chemical elements in thyroid gland tissues. According to gender, it has been described that higher Br and lower Ca and Mg contents in thyroids from females than in those from males, but a Ca deficiency was only detected in young females (< 40 yr) when age groups were considered [85]. It has also been pointed out that a pronounced age-related trend for the increase in Zn contents both for healthy males [86] and females [87]. It has also been suggested that such an age-related increase for Br, Fe, and Se contents in thyroids from females [38, 87] and for I and Se in thyroids from males [88] too. Such imbalance could be associated with subclinical hypothyroidism (that is, mildly low thyroid function) according to Zaichik and Zaichik [85]. Thus, these researchers have indicated that some disturbance in intrathyroid trace element contents may be assumed with increasing age [85,86].
An accurate and robust method based on the use of TMAH sample dissolution combined with matrix modifiers has been applied for multielemental analysis on small-sized biological samples (50-200 mg). The method showed a high precision: RSD lower than 10% by ICP-MS, and lower than 5% by ICP-OES.
Goiter samples showed statistically significantly higher contents of I, Se, Zn, Ca, and S, and lower contents of Mn and P than autoimmune disease thyroid samples. This is probably due to the different pathophysiological mechanisms related to such diseases. Malignant samples showed lower Zn and Mg contents. Element content correlations obtained suggest that the body element balance of non-cancerigenous goiter patients could not be highly affected, in comparison to that of patients diagnosed with autoimmune disease thyroid disorders or tumors.
Aknowledgement
The authors would like to thank all the anonymous patients who gave their consent for research use of residual tissue and to all the hospital staff who participated in their sampling.
Funding for the open access charge was provided by Universidade de Vigo/CISUG.
Data availability: When creating a data availability statement, authors are encouraged to consider the minimal dataset that would be necessary to interpret, replicate and build upon the findings reported in the article.
Declaration of interests: The authors declare that they have no known competing financial interests or personal relationships that could have appeared to influence the work reported in this paper.
The authors declare the following financial interests/personal relationships which may be considered as potential competing interests:
The authors have no relevant financial or non-financial interests to disclose.
Author contributions
Jorge Millos: Conceptualization, Methodology, Validation, Formal analysis, Investigation, Resources, Writing-Original Draft preparation, Visualization and Supervision.
Paula Álvarez Iglesias: Data curation, Writing- Original draft preparation, Review & Editing and Visualization.
Carmen Fachal Bermúdez: Resources, Writing-Review & Editing.
Rosa Lomba: Validation, Investigation.
José Gómez: Validation, Investigation.
Alberto Acuña: Validation, Investigation.
Jesus Estevez Sio: Investigation.
Sandra Gil Casal: Investigation.
Estefanía López: Investigation.
Vicente Rodríguez: Investigation.
- Tonacchera M, Pinchera A, Vitti P. Assessment of nodular goiter. Best Pract Res Clin Endocrinol Metab. 2010;24(1):51-61. Available from: https://doi.org/10.1016/j.beem.2009.08.008
- Ghaznavi S, Lithgow K, Agrawal V, Paschke R. Nontoxic goiter. In: Huhtaniemi I, Martini L, editors in chief. Encyclopedia of Endocrine Diseases. 2nd ed. Academic Press; 2018. p. 524-8.
- Di Marco A, Palazzo F. Goitre and thyroid cancer. Medicine. 2021;49(8):522-6.
- Knobel K. Etiopathology, clinical features, and treatment of diffuse and multinodular nontoxic goiter. J Endocrinol Invest. 2016;39:357-73. Available from: https://dx.doi.org/10.1007/s40618-015-0391-7.
- Iddah MA, Macharia BN. Autoimmune thyroid disorders. ISRN Endocrinol. 2013;2013:509764. Available from: https://dx.doi.org/10.1155/2013/509764
- Antonelli A, Ferrari SM, Corrado A, Di Domenicantonio A, Fallahi P. Autoimmune thyroid disorders. Autoimmun Rev. 2015;14(2):174-80. Available from: https://dx.doi.org/10.1016/j.autrev.2014.10.016.
- Franco JS, Amaya-Amaya J, Anaya JM. Thyroid disease and autoimmune diseases. In: Anaya JM, Shoenfeld Y, Rojas-Villarraga A, Levy A, Cervera R, editors. Autoimmunity: From Bench to Bedside. Bogota (Colombia): El Rosario University Press; 2013. p. 537-61.
- Guastamacchia E, Giagulli VA, Licchelli B, Triggiani V. Selenium and iodine in autoimmune thyroiditis. Endocr Metab Immune Disord Drug Targets. 2015;15:288-92. Available from: https://dx.doi.org/10.2174/1871530315666150619094242.
- Arthur JR, Beckett G. Thyroid function. Br Med Bull. 1999;55(3):658-68. Available from: https://dx.doi.org/10.1258/0007142991902538.
- Köhrle J. The trace element selenium and the thyroid gland. Biochimie. 1999;81(5):527-33. Available from: https://dx.doi.org/10.1016/S0300-9084(99)80105-9.
- Köhrle J, Jakob F, Contempré B, Dumont JE. Selenium, the thyroid, and the endocrine system. Endocr Rev. 2005;26(7):944-84. Available from: https://dx.doi.org/10.1210/er.2001-0034.
- Köhrle J, Gärtner R. Selenium and thyroid. Best Pract Res Clin Endocrinol Metab. 2009;23(6):815-27. Available from: https://dx.doi.org/10.1016/j.beem.2009.08.002.
- Steinbrenner H, Sies H. Protection against reactive oxygen species by selenoproteins. Biochim Biophys Acta. 2009;1790(11):1478-85. Available from: https://dx.doi.org/10.1016/j.bbagen.2009.02.014.
- Vanderpas JB, Contempré B, Duale NL, Goossens W, Bebe N, Thorpe R, et al. Iodine and selenium deficiency associated with cretinism in northern Zaire. Am J Clin Nutr. 1990;52:1087-93. Available from: https://doi.org/10.1093/ajcn/52.6.1087
- Hincal F. Trace elements in growth: iodine and selenium status of Turkish children. J Trace Elem Med Biol. 2007;21 Suppl 1:40-3. Available from: https://dx.doi.org/10.1016/j.temb.2007.09.012.
- World Health Organization. Assessment of iodine deficiency disorders and monitoring their elimination: a guide for programme managers. 3rd ed. Geneva: WHO; 2007. 97 p.
- Kazi Tani LS, Dennouni-Medjati N, Toubhans B, Charlet L. Selenium deficiency—from soil to thyroid cancer. Appl Sci. 2020;10:5368. Available from: https://dx.doi.org/10.3390/app10155368.
- Hess S. The impact of common micronutrient deficiencies on iodine and thyroid metabolism: the evidence from human studies. Best Pract Res Clin Endocrinol Metab. 2010;24(1):117-32. Available from: https://dx.doi.org/10.1016/j.beem.2009.08.012.
- Köhrle J. Selenium, iodine and iron—essential trace elements for thyroid hormone synthesis and metabolism. Int J Mol Sci. 2023;24:3393. Available from: https://dx.doi.org/10.3390/ijms24043393.
- Wang F, Li C, Li S, Cui L, Zhao J, Liao L. Selenium and thyroid diseases. Front Endocrinol. 2023;14:1133000. Available from: https://dx.doi.org/10.3389/fendo.2023.1133000.
- Combs GF. Selenium in global food systems. Br J Nutr. 2001;85:517-47. Available from: https://dx.doi.org/10.1079/bjn2000280.
- Gorini F, Sabatino L, Pingitore A, Vassalle C. Selenium: an element of life essential for thyroid function. Molecules. 2021;26:7084. Available from: https://dx.doi.org/10.3390/molecules26237084.
- Triggiani V, Tafaro E, Giagulli VA, Sabbà C, Resta F, Licchilli B, Guastamacchia E. Role of iodine, selenium and other micronutrients in thyroid function and disorders. Endocr Metab Immune Disord Drug Targets. 2009;9:277-94. Available from: https://doi.org/10.2174/187153009789044392
- Dahiya K, Verma M, Dhankhar R, Ghalaut VS, Glalaut PS, Sachdeva A, Malik U, Kumar R. Thyroid profile and iron metabolism: mutual relationship in hypothyroidism. Biomed Res. 2016;27(4):1212-5.
- Manisha A, Roshan KM, Sudeep K, Imran M, Sumesh PS. Study of trace elements in patients of hypothyroidism with special reference to zinc and copper. Biomed J Sci Tech Res. 2018;6(2):BJSTR.MS.ID.001336. Available from: https://dx.doi.org/10.26717/BJSTR.2018.06.001336.
- Skrajnowska D, Bobroswka-Korczak B. Role of zinc in immune system and anti-cancer defense mechanisms. Nutrients. 2019;11(1):2273. Available from: https://dx.doi.org/10.3390/nu11102273.
- Khanam S. Impact of zinc on thyroid metabolism. J Diabetes Metab Disord Control. 2018;5(1):27-8.
- Wessels I, Fischer HJ, Rink L. Dietary and physiological effects of zinc on the immune system. Annu Rev Nutr. 2021;41:133-75. Available from: https://dx.doi.org/10.1146/annurev-nutr-122021-120635.
- Kucharzewski M, Braziewicz J, Majewska U, Góźdź S. Copper, zinc, and selenium in whole blood and thyroid tissue of people with various thyroid diseases. Biol Trace Elem Res. 2003;93:9-19. Available from: https://dx.doi.org/10.1385/bter:93-1-3:9.
- Edmons CJ, Smith T. Total body potassium in relation to thyroid hormones and hyperthyroidism. Clin Sci. 1981;60(3):311-8. Available from: https://dx.doi.org/10.1042/cs0600611.
- Soldin O, Aschner M. Effects of manganese on thyroid hormone homeostasis. Neurotoxicology. 2007;28(5):951-6. Available from: https://doi.org/10.1016/j.neuro.2007.05.003
- Schwarz C, Leichtle AB, Arampatzis S, Fiedler GM, Zimmermann H, Exadaktlyos AK, Lindner G. Thyroid function and serum electrolytes: does an association really exist? Swiss Med Wkly. 2012;142:w13669. Available from: https://dx.doi.org/10.4414/smw.2012.13669.
- Nechiporuk VM, Korda MM. Metabolism of cysteine in experimental hyper- and hypothyroidism in rats. Med Clin Chem. 2017;4:32-40. Available from: https://dx.doi.org/10.11603/mcch.2410-681X.2017.v00i4.8433.
- Jurdziak M, Gać P, Porȩba M, Szymańska-Chabowska A, Mazur G, Porȩba R. Concentration of thyrotropic hormone in persons occupationally exposed to lead, cadmium and arsenic. Biol Trace Elem Res. 2018;182:196-203.
- Wang K, Wei H, Zhang W, Li Z, Ding L, Yu T, Tan L, Liu Y, Liu T, Wang H, Fan Y, Zhang P, Shan Z, Zhu M. Severely low serum magnesium is associated with increased risks of positive anti-thyroglobulin antibody and hypothyroidism: a cross-sectional study. Sci Rep. 2018;8(1):9904. Available from: https://dx.doi.org/10.1038/s41598-018-28362-5.
- Błażewicz A, Wiśniewska P, Skórzyńska-Dziduszko K. Selected essential and toxic chemical elements in hypothyroidism—a literature review (2001-2021). Int J Mol Sci. 2021;22:10147. Available from: https://dx.doi.org/10.3390/ijms221810147.
- Boulyga SF, Becker JS, Malechenko AF, Dietze HJ. Application of ICP-MS for multielement analysis in small sample amounts of pathological thyroid tissue. Microchim Acta. 2000;134(3):215-22.
- Zaichik V, Zaichik S. Variation with age of chemical element contents in females’ thyroids investigated by neutron activation analysis and inductively coupled plasma atomic emission spectrometry. J Biochem Anal Studies. 2018;3(1):1-10. Available from: https://dx.doi.org/10.16966/2576-5833.114.
- Knapp G, Maichin B, Fecher P, Hasse S, Schramel P. Iodine determination in biological materials: options for sample preparation and final determination. Fresenius J Anal Chem.1998;362:508-13.
- Rädlinger G, Heumann KG. Iodine determination in food samples using inductively coupled plasma isotope dilution mass spectrometry. Anal Chem. 1998;70(11):2221-4. Available from: https://doi.org/10.1021/ac971308k
- Fecher PA, Goldmann I, Nagengast A. Determination of iodine in food samples by inductively coupled plasma mass spectrometry after alkaline extraction. J Anal At Spectrom. 1998;13:977-82.
- Nóbrega JA, Santos MC, Sousa RA, Cadore S, Barnes RM, Tatro M. Sample preparation in alkaline media. Spectrochim Acta B At Spectrosc. 2006;61:465-95. Available from: https://dx.doi.org/10.1016/j.sab.2006.02.006.
- Batista BL, Grotto D, Rodrigues JL, Souza VCO, Barbosa JrF. Determination of trace elements in biological samples by ICP-MS with tetramethylammonium hydroxide solubilization at room temperature. Anal Chim Acta. 2009;646:23-9. Available from: https://dx.doi.org/10.1016/j.aca.2009.05.022.
- Batista BL, Rodrigues JL, Nunes JA, Torme K, Curtius AJ, Barbosa JrF. Simultaneous determination of Cd, Cu, Mn, Ni, Pb and Zn in nail samples by ICP-MS after TMAH solubilization at room temperature: comparison with ETAAS. Talanta. 2008;76:575-9. Available from: https://dx.doi.org/10.1016/j.talanta.2008.03.046.
- Rodrigues JL, Nunes JA, Batista BL, Souza SS, Barbosa JrF. A fast method for the determination of 16 elements in hair samples by ICP-MS with TMAH solubilization at room temperature. J Anal At Spectrom. 2008;23:992-6. Available from: https://dx.doi.org/10.1039/b800595h.
- Huynh D, Zhou SJ, Gibson R, Palmer L, Muhlhausler B. Validation of an optimized method for the determination of iodine in human breast milk by ICP-MS after TMAH extraction. J Trace Elem Med Biol. 2015;29:75-82. Available from: https://dx.doi.org/10.1016/j.temb.2014.07.005.
- Uchida T, Isoyama H, Yamada K, Oguchi K, Nakagawa G, Sugie H, Iida C. Determination of twelve elements in botanical samples with ICP-AES after leaching with TMAH and EDTA. Anal Chim Acta. 1992;256(2):277-84. Available from: https://dx.doi.org/10.1016/003-2670(92)85355-A.
- Pappas RS. Sample preparation problem solving for ICP-MS with liquid introduction systems I. Solubility, chelation, and memory effects. Spectroscopy. 2012;27(5):20-31.
- Mohd-Taufek N, Cartwright D, Davies M, Hewavithara AK, Koorts P, Shaw PN, et al. The simultaneous analysis of eight essential trace elements in human milk by ICP-MS. Food Anal Methods. 2016;9:2068-75.
- Filgueiras AV, Lavilla I, Bendicho C. Ultrasound-assisted solubilization of trace and minor metals from plant tissue using EDTA in alkaline medium. Fresenius J Anal Chem. 2001;369:451-6. Available from: https://dx.doi.org/10.1007/s00216000648.
- Todorov TI, Gray PJ. Analysis of iodine in food samples by ICP-MS. Food Addit Contam A. 2016;33(2):282-92. Available from: https://dx.doi.org/10.1080/19440049.2015.1131337.
- Serrano R, Grindlay G, Luis Gras JM. Insight into the origin of carbon matrix effects on the emission signal of atomic lines in ICP-OES. Spectrochim Acta B At Spectrosc. 2021;177:106070. Available from: https://dx.doi.org/10.1016/j.sab.2021.106070.
- Liu S, Han Z, Kong X, Zhang, Lv Z, Yuan G. Organic matrix effects in ICP-MS: a tutorial review. Appl Spectrosc Rev. 2021. Available from: https://dx.doi.org/10.1080/05704928.2021.1897991.
- Food and Drug Administration. ICP-MS determination of iodine in food using TMAH extraction. Section 4.13 of the Element Analysis Manual for Food and Related Products. FDA; 2017. 14 p.
- Julsham K, Dahl L, Eckhoff K. Determination of iodine in seafood by ICP-MS. J AOAC Int. 2001;84(6):1976-83.
- Matusiewicz H, Golik B. Determination of major and trace elements in biological materials by MIP-OES following TMAH solubilization. Microchem J. 2004;73:23-9. Available from: https://dx.doi.org/10.1016/j.microc.2003.10.007.
- Abraha B, Admassu H, Mahmud A, Tsige N, Shui XW, Fang Y. Effect of processing methods on nutritional and physicochemical composition of fish: a review. MOJ Food Process Technol. 2018;6(4):376-82. Available from: https://dx.doi.org/10.15406/mojfpt.2018.06.00191.
- Fernández A, Grienke U, Soler-Vila A, Guihéneuf F, Stengel DB, Tasdemir D. Seasonal and geographical variations in the biochemical composition of the blue mussel (Mytilus edulis L.) from Ireland. Food Chem. 2015;177:43-52. Available from: https://dx.doi.org/10.1016/j.foodchem.2014.12.062.
- Kailasapathy K. Chemical composition, physical and functional properties of milk and milk ingredients. In: Chandan RC, Kilara A, Shah NP, editors. Dairy Processing and Quality Assurance. 2nd ed. John Wiley & Sons; 2016. p. 77-105. Available from: https://dx.doi.org/10.1002/978111881279.ch04.
- Zaichik V, Zaichik S. Levels of chemical element contents in thyroid as potential biomarkers for cancer diagnosis (a preliminary study). J Cancer Metastasis Treat. 2018;4:60. Available from: https://dx.doi.org/10.20517/2394-4722.2018.52.
- Zaichick V. Distinguish thyroid malignant from benign alterations using chemical element contents in nodular tissue determined by neutron activation and ICP-AES. J Pharm Pharmacol Res. 2022;5(4). Available from: https://dx.doi.org/10.31579/2693-7247/074.
- Zaichik V. Determination of twenty chemical element contents in normal and goitrous thyroid using X-ray fluorescent and neutron activation analysis. World J Adv Res Rev. 2021;11(2):130-46. Available from: https://dx.doi.org/10.30574/wjarr.2021.11.2.0352.
- Baker SB, Worthley LIG. The essentials of calcium, magnesium and phosphate metabolism: Part I. Physiology. Crit Care Resusc. 2002;4:301-6.
- Tsatsoulis A. The role of iodine vs selenium on the rising trend of autoimmune thyroiditis in iodine sufficient countries—an opinion article. Open Acc J Thyroid Res. 2018;2(1):12-4. Available from: https://dx.doi.org/10.15406/oajtrt.2018.02.00012.
- Zaichik V. Comparison of chemical element contents in thyroid goiter, adenoma, and thyroiditis investigated using X-ray fluorescence and neutron activation analysis. Saudi J Biomed Res. 2021;6(12):268-79. Available from: https://dx.doi.org/10.36348/sjbr.2021.v06i12.001.
- Sturniolo G, Mesa J. Selenium supplementation and autoimmune thyroid diseases. Endocrinol Nutr. 2013;60(8):423-6. Available from: https://dx.doi.org/10.1016/j.endonu.2013.07.001.
- Duntas LH. The role of iodine and selenium in autoimmune thyroiditis. Horm Metab Res. 2015;47(10):721-6. Available from: https://dx.doi.org/10.1055/s-0035-15559631.
- Jonklaas J, Danielsen M, Wang H. A pilot study of serum selenium, vitamin D, and thyrotropin concentrations in patients with thyroid cancer. Thyroid. 2013;23(9):1079-86. Available from: https://doi.org/10.1089/thy.2012.0548
- Zimmermann M, Galetti V. Iodine intake as a risk factor for thyroid cancer: a comprehensive review of animal and human studies. Thyroid Res. 2015;8:8. Available from: https://doi.org/10.1186/s13044-015-0020-8
- Zhu G. A high iodine intake, thyroid diseases and the prevalence of papillary carcinoma (PTC). Cancer Rep Rev. 2017;2(2):1-9. Available from: https://dx.doi.org/10.15761/CRR.1000143.
- Maeda K, Yokode Y, Sasa Y, Kusuyama H, Uda M. Multielemental analysis of human thyroid glands using particle-induced X-ray emission (PIXE). Nucl Instrum Methods Phys Res B. 1987;22(1-3):188-90.
- Al-Juboori IA, Al-Rawi R, A-Hakeim HK. Estimation of serum copper, manganese, selenium, and zinc in hypothyroidism patients. IUFS J Biol. 2009;68(2):121-6.
- Zaichick V, Zaichick S. Trace element contents in thyroid cancer investigated by energy dispersive X-ray fluorescent analysis. Am J Cancer Res Rev. 2018;2:5.
- Vázquez-Lorente H, Dundjerovic DM, Tatič SB, Rodríguez-Menéndez S, González-Iglesias H, Gomes CM, Paunovič IR, Dragutinovič VV. Relationship between trace elements and matrix metalloproteinases 2 and 9 and their tissue inhibitors in medullary thyroid carcinoma. Biol Trace Elem Res. 2023;201:3225-32. Available from: https://dx.doi.org/10.1007/s12011-022-03431-z.
- Sridevi D, Dambal AA, Sidrah, Challa AS, Padaki SK. A study of serum magnesium, calcium and phosphorous in hypothyroidism. Int J Clin Biochem Res. 2016;3(2):236-9.
- Akter S, Reza MM, Alam MR. Study of serum magnesium, calcium and phosphorus levels in subclinical and overt hypothyroidism. Saudi J Med. 2021;6(12):410-3.
- Jha RK, Kondhalkar AA, Panchbudhe SA, Jha RK. Study of calcium, magnesium and phosphorus in hypothyroidism patients in Vidarbha region. Biosci Biotechnol Res Commun. 2021;14(7):99-103. Available from: https://dx.doi.org/10.21786/bbrc/14.7.24.
- Dhungana A, Shreevastva NK, Pant S, Pokharel BR. A study of serum calcium, phosphorus and magnesium level in hypothyroid cases. J Pathol Nepal. 2022;12:1933-7. Available from: https://dx.doi.org/10.3126/jpn.v12i1.40422.
- Favus MJ, Bushinsky DA, Lemann Jr J. Regulation of calcium, magnesium, and phosphate metabolism. In: Favus MJ, editor. Primer on the Metabolic Bone Diseases and Disorders of Mineral Metabolism. 6th ed. Washington DC: American Society for Bone and Mineral Research; 2006. p. 76-117.
- Guerlain J, Perie S, Lefevre M, Perez J, Vandermeersch S, Jouanneau C, Huguet L, Frochot V, Letavernier E, Weil R, Rouziere S, Bazin D, Daudon M, Haymann J-P. Localization and characterization of thyroid microcalcifications: a histopathological study. PLoS ONE. 2019;14(10):e0224138. Available from: https://dx.doi.org/10.1371/journal.pone.0224138.
- Stojsavljević A, Rovčanin B, Krstić D, Borković-Mitić S, Paunović I, Kodranov I, Gavrović-Jankulović M, Manojlović D. Evaluation of trace metals in thyroid tissues: comparative analysis with benign and malignant thyroid diseases. Ecotoxicol Environ Saf. 2019;183:109479. Available from: https://dx.doi.org/10.1016/j.ecoenv.2019.109479.
- van Gerwen M, Alerte E, Alsen M, Little C, Sinclair C, Genden E. The role of heavy metals in thyroid cancer: a meta-analysis. J Trace Elem Med Biol. 2022;69:126900. Available from: https://dx.doi.org/10.1016/j.jtemb.2021.126900.
- Al-Sayer H, Mathew TC, Asfar S, Khourshed M, Al-Bader A, Behbehani A, Dashti H. Serum changes in trace elements during thyroid cancers. Mol Cell Biochem. 2004;260:1-5. Available from: https://doi.org/10.1023/b:mcbi.0000026027.20680.c7
- Zhao X, Cao Y, Jin H, Wang X, Zhang L, Zhang Y, Yu Y, Huang Y, Gao Y, Zhang J. Hydrogen sulfide promotes thyroid hormone synthesis and secretion by upregulating sirtuin-1. Front Pharmacol. 2022;13:838248. Available from: https://dx.doi.org/10.3389/fphar.2022.838248.
- Zaichik V, Zaichik S. Possible role of inadequate quantities of intra-thyroidal bromine, calcium and magnesium in the etiology of female subclinical hypothyroidism. Interv Gynecol Women’s Healthc. 2018;1(3):52-9. Available from: https://dx.doi.org/10.32474/IGWHC.2018.01.000113.
- Zaichick V, Zaichick S. Age-related changes of some trace element contents in intact thyroid of males investigated by energy dispersive X-ray fluorescent analysis. MOJ Gerontol Geriatr. 2017;1(5):133-40. Available from: https://dx.doi.org/10.15406/mojgg.2017.01.00028.
- Zaichick V. Relationships between iodine and some trace elements in normal thyroid of females investigated by neutron activation analysis. Appl Chem Eng. 2023;6(1):20-7. Available from: https://dx.doi.org/10.24294/ace.v6i1.1867.
- Zaichick V. Relationships between iodine and some trace elements in normal thyroid of males investigated by neutron activation analysis. Arch Epidemiol Public Health Res. 2023;2(1):154-60.
- Błażewicz A, Dolliver W, Sivsammye S, Deol A, Radhawwa R, Orlicz-Szczȩsna G, Błażewicz R. Determination of cadmium, cobalt, copper, iron, manganese, and zinc in thyroid glands of patients with diagnosed nodular goiter using ion chromatography. J Chromatogr B Biomed Appl. 2010;878:34-8. Available from: https://dx.doi.org/10.1016/j.jchromb.2009.11.014.
- Zaichick V. Comparison between bromine, calcium, chlorine, iodine, potassium, magnesium, manganese, and sodium contents in macro- and micro-follicular colloid goiter. Innovare J Med Sci. 2021;9(6):5-9. Available from: https://dx.doi.org/10.22159/ijms.2021v9i6.42883.